|
|
|
 |
Precipitation, inches |
 |
|
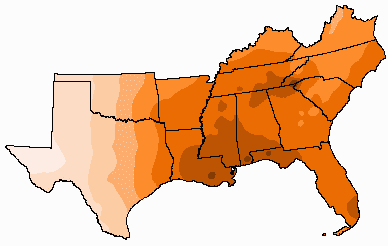
| The downward movement of chemicals through soils is highly
dependent upon the amount of water entering and moving deeply into the
soil. Therefore the amount and distribution of precipitation is important.
If supplemental irrigation is used, the irrigation amounts and timing are
also important. The map above displays the long term average annual
precipitation for the southern region. Daily infiltration amounts are generally
needed to estimate chemical movement since large storms cause major leaching
losses. At one location, large variations in leaching can occur from year
to year because of differences in rainfall distributions over time. Rainfall
distributions are presented for selected weather stations when viewing
rainfall for a particular state.
The precipitation map above and others for individual states are based on data from Dr. William W. Hargrove at Oak Ridge National Laboratory. Dr. Hargrove estimated long term precipitation and temperature values for 1 km square cells across the 13 states in southeastern U.S. Data from 373 weather stations within the 13 southern states and 205 stations in the surrounding area were used. These data were from the Historical Climatology Database. Spline functions were used to estimate the values for each cell. This results in some smoothing of the data from individual stations. Contact Dr. Hargrove for more details. |
|